#Lookalike account sourcing: mine closed-won for pipeline
Copy page
TL;DR: Your closed-won list is a better seed for sourcing than your ICP document, because it reflects who actually bought, not who you hoped would buy. Lookalike sourcing built from that list finds real pipeline, but it also reliably surfaces accounts that resemble your winners on paper and share none of the underlying reason they bought. The fix is treating lookalike output as a shortlist to validate, not a list to blast.
#Table of contents
- What lookalike account sourcing actually is
- Why closed-won beats your ICP document
- The lookalike sourcing pipeline
- Firmographic lookalikes versus behavioral lookalikes
- Where lookalikes lie
- The seed list problem nobody checks
- Sizing the lookalike list without drowning your reps
- Feeding lookalikes into tiering
- Testing a lookalike batch before you scale it
- Where FirstSales fits into lookalike sourcing
- What is overrated about lookalike modeling
- FAQ
- Conclusion
Most outbound teams source accounts from a static ICP document written months ago by someone who has since left the deal desk.
That document describes a hypothesis.
Your closed-won list describes a fact: these specific companies, with this specific profile, at this specific moment, wrote a check.
Lookalike account sourcing takes that fact and asks a narrow question: which other companies share enough of the same signal to be worth a look.
It is not magic and it is not new. What has changed is the volume of firmographic and technographic data available to run the comparison cheaply, and the number of teams running it badly because the comparison feels more scientific than it is.
#What lookalike account sourcing actually is
Lookalike sourcing starts with a seed list, usually your closed-won accounts, and finds other companies that resemble those seeds on a defined set of attributes.
Those attributes are usually firmographic: employee count band, industry code, funding stage, tech stack, geography.
Some vendors add behavioral signal on top: hiring velocity, web traffic pattern, job posting language, review site activity.
The output is a ranked list of accounts, each scored by similarity to your seed set rather than by a fixed rule like "50 to 200 employees in SaaS."
That ranking is the entire value proposition, and also the entire risk. A similarity score tells you two companies look alike on the axes you measured. It says nothing about whether they look alike on the axis that actually caused the sale.
#Why closed-won beats your ICP document
An ICP document is written once, gets stale within a quarter, and rarely gets rewritten once a team is busy hitting number.
Closed-won data updates itself every time a deal closes.
It also carries information an ICP document cannot: the actual reason each account bought, buried in call notes, the deal's original trigger, and the account's real firmographic profile rather than the profile someone assumed when writing the ICP.
We cover the failure mode of static profiling in more depth in ideal customer profile, and the short version applies directly here.
A profile written from assumption drifts from reality within two or three quarters as your product, pricing, and market shift underneath it.
A profile mined from the last 90 days of closed-won deals does not drift, because it is rebuilt from what just happened rather than what someone once believed would happen.
The catch is sample size. A team with 12 closed-won deals a quarter does not have enough seeds to build a statistically meaningful lookalike model, and treating 12 data points as a pattern is how false confidence creeps in.
Below roughly 30 to 50 closed-won accounts in the trailing 6 to 12 months, lookalike modeling is closer to guessing dressed up as data science. Above that, the signal starts to separate from noise.
#The lookalike sourcing pipeline
A working lookalike pipeline has five stages, and skipping any of them is where teams end up with a list that looks great in a spreadsheet and converts at half the rate of a manually built one.
Stage one is the seed list. Stage two is attribute extraction, deciding which properties of your seed accounts you are actually going to match on.
Stage three is the scoring itself, usually run through a data provider or a purpose-built lookalike tool rather than built from scratch.
Stage four is the filter almost everyone skips: removing accounts that score high on similarity but carry a known negative signal, which we cover in negative signals in a lead list.
Stage five is validation on a small batch before committing full sending volume, which we walk through later in this piece.
Most teams run stages one through three and skip four and five entirely. That is exactly backwards, because four and five are where the accuracy actually gets built in.
#Firmographic lookalikes versus behavioral lookalikes
Firmographic lookalikes match on static company properties: size, industry, geography, funding stage, tech stack.
They are cheap to build, stable over time, and available from almost every B2B data provider on the market.
Behavioral lookalikes match on dynamic activity: hiring pace, website traffic changes, job posting language, review site engagement, recent leadership changes.
They are harder to build, noisier, and go stale faster, but they capture something firmographic matching cannot: timing.
A firmographic lookalike tells you a company looks like your winners in general shape. A behavioral lookalike tells you a company looks like your winners and is showing activity right now that resembles what your winners were doing right before they bought.
The second is closer to a buying signal than a static profile match, and we go deeper on that distinction in intent-based prospecting versus static lists.
Most mature lookalike programs blend both: firmographic match narrows the universe, behavioral signal ranks who inside that universe to reach out to first.
Running firmographic matching alone produces a large, undifferentiated list. Running behavioral matching alone without a firmographic floor produces a list full of companies that are simply too small, too large, or in the wrong category to ever have bought your product regardless of their current activity.
#Where lookalikes lie
This is the part vendor decks skip, and it is the part that actually determines whether a lookalike program earns its keep.
Similarity on the attributes you measured does not imply similarity on the attribute that caused the sale.
A classic example: two SaaS companies both employ 80 to 150 people, both raised a Series B, both use the same CRM and the same cloud provider.
One bought your product because a new VP of sales had used it at a previous company and pushed for it internally. The other has none of that internal champion history and looks identical on paper.
No firmographic or technographic attribute captures "a former user is now inside this account pushing for it." That is exactly the kind of context we cover in the why-now field in your CRM, and it is invisible to almost every lookalike model on the market.
Correlation without a causal story is the core failure mode. A high similarity score can reflect a real underlying reason or a coincidence in the attributes you happened to measure.
| Lookalike signal type | ✓ Reliable indicator | ✗ Common false positive |
|---|---|---|
| Employee count band | ✓ Filters obvious size mismatches | ✗ Ignores whether headcount is growing or shrinking |
| Industry code | ✓ Narrows to plausible buyers | ✗ Same code covers wildly different business models |
| Tech stack overlap | ✓ Signals compatible workflow | ✗ Common tools like Slack or Salesforce say almost nothing |
| Funding stage | ✓ Correlates with budget availability | ✗ Recently funded does not mean actively buying now |
| Hiring velocity in relevant role | ✓ Suggests a live, funded initiative | ✗ Backfill hires look identical to expansion hires |
| Website traffic growth | ✓ Can indicate momentum | ✗ Traffic spikes from unrelated marketing, not buying intent |
| Review site activity | ✓ Shows active evaluation behavior | ✗ Activity often targets a competitor, not you |
The table's right column is longer for a reason. Every one of these signals is genuinely useful, and every one of them also produces confident-looking false positives when used in isolation.
#The seed list problem nobody checks
Lookalike quality is bounded by seed list quality, and most teams never audit what is actually in their seed list before building a model off it.
If your closed-won list includes a handful of accounts that were won on unsustainable discounting, a one-off relationship, or a deal that later churned inside 90 days, your lookalike model will faithfully find you more of exactly that.
A seed list that mixes healthy accounts with fragile ones produces a lookalike list that mixes healthy prospects with fragile ones, at whatever ratio the seed list had.
The fix is boring but effective: before building a lookalike model, split closed-won into accounts still active and expanding, accounts that churned within a year, and accounts won on terms you would not repeat.
Build the model only on the first group. The other two groups are teaching the model to find you more churn risk, not more revenue.
This is the same discipline behind clean list hygiene generally, covered in B2B data decay and list hygiene: a model is only as good as the data feeding it, and nobody fixes a bad model by adding more of the same bad data.
#Sizing the lookalike list without drowning your reps
A similarity score gives you a ranking, not a cutoff, and the cutoff is a business decision your provider's dashboard will not make for you.
Setting the threshold too loose produces a list in the thousands that looks impressive in a report and converts like a cold, unqualified list because half of it barely resembles your seed accounts.
Setting it too tight produces a shortlist of thirty accounts that all convert well but exhausts itself in a month.
A workable starting point: take the top decile of scored accounts, roughly the top 10%, and treat everything below that as a secondary tier worth revisiting only after the top tier has been worked.
This mirrors the total addressable market discipline in TAM reality check for outbound: a lookalike list that is larger than your team can meaningfully research and personalize against is not an asset, it is a queue of accounts that will get generic outreach and underperform regardless of how good the underlying match was.
Reach exceeding capacity is the single most common way a good lookalike model produces disappointing results. The model did its job. The go-to-market motion around it could not keep up.
#Feeding lookalikes into tiering
A raw lookalike list is not ready for outreach until it has been folded into an account tiering system, because not every account on the list deserves the same research depth or cadence.
The highest-scoring lookalikes, especially ones carrying a live behavioral signal, deserve the account-level research investment described in account tiering for outbound.
Lower-scoring lookalikes further down the ranked list can run on a lighter, more templated cadence, since the expected conversion is lower and heavy personalization spend on a marginal account is a poor use of a researcher's time.
Treating a lookalike list as one undifferentiated batch throws away the one piece of extra information the model actually gave you: a rank order.
That rank order is the tiering signal. Use it instead of re-deriving tiers from scratch.
#Testing a lookalike batch before you scale it
Before committing full campaign volume to a new lookalike batch, run it through a validation window the same way you would validate any new segment.
A batch of 200 to 300 accounts, worked through a real sequence with real personalization, tells you within two to three weeks whether the batch's reply and meeting rate resembles your existing book of business or falls well short of it.
We lay out the mechanics of this test in validate a segment before scaling, and the same threshold logic applies directly to a lookalike batch.
If the validation batch's reply rate lands within range of your systematised-campaign baseline, roughly 10 to 18% on a well-run sequence, the batch is worth scaling.
If it lands closer to the 1 to 3% floor typical of generic, unqualified sends, the similarity score was measuring the wrong thing for this batch, and scaling it further only compounds the mistake at volume.
This is the checkpoint most teams skip because a fresh lookalike list feels validated by the model that produced it. The model validated similarity. It did not validate conversion. Only a real send does that.
#Where FirstSales fits into lookalike sourcing
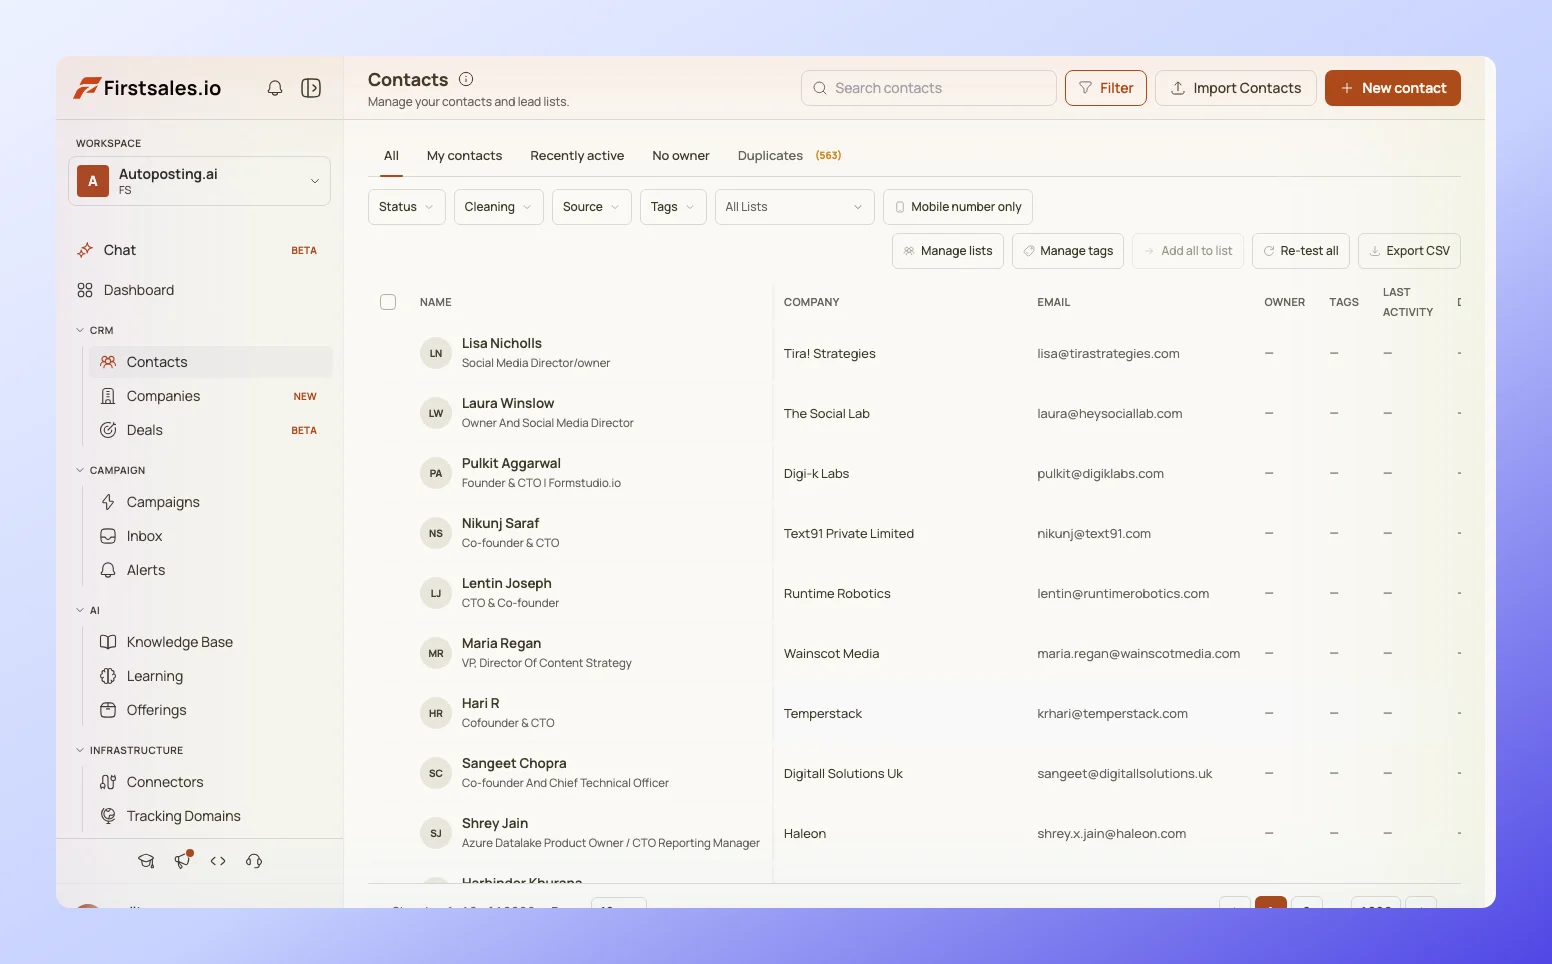 FirstSales signal-based prospecting view showing ranked accounts with buying signal context
FirstSales layers signal on top of firmographic matching rather than treating a similarity score as the finish line.
A lookalike list imported into the platform gets checked against live buying signal, hiring activity, funding events, and technographic change, before it enters a sending sequence, so the ranked list from your data provider gets a second, independent pass rather than going straight to outreach.
That second pass is where the false positives in the table above tend to get caught: an account that scores high on static similarity but shows no live signal drops in priority automatically, rather than getting the same cadence as an account that scores high on both.
The platform also keeps a record of which lookalike batches actually converted, so the next round of seed-list selection can exclude accounts that looked good on paper but never replied, tightening the model over time instead of repeating the same mistake at larger volume.
None of that replaces the seed list audit or the validation batch described above. It removes the guesswork of deciding which high-scoring accounts to reach first, and which to park until they show more than a resemblance.
#What is overrated about lookalike modeling
The industry pitch on lookalike sourcing implies that better data alone fixes targeting.
It does not. A better data provider gives you a more accurate similarity score on the attributes it measures. It cannot measure the attribute that actually caused a customer to buy, because that attribute usually lives in a sales call note, not a firmographic database.
Vendors also tend to oversell list size as a proxy for quality. A provider that returns 50,000 lookalike accounts sounds more impressive than one that returns 4,000, but the honest question is what fraction of either list would survive a validation batch, and providers rarely publish that number because it is unflattering.
The most overrated claim is that a lookalike model, run once, stays accurate. Markets shift, your own win pattern shifts as your product changes, and a model trained on last year's closed-won list quietly drifts out of date the same way a static ICP document does.
Treat a lookalike model the way you would treat any other forecasting tool: rebuild it on a schedule, audit the seed list every time, and never let a similarity score substitute for a real validation batch before you commit volume.
#FAQ
#What is lookalike account sourcing?
It is the practice of finding new target accounts by matching them against the firmographic, technographic, or behavioral profile of your existing closed-won customers, rather than a static ICP definition.
#How is a lookalike list different from an ICP list?
An ICP list is built from a written definition of your ideal customer, usually created once and updated rarely. A lookalike list is built from actual closed-won data and can be rebuilt as often as your win pattern changes.
#How many closed-won accounts do I need before building a lookalike model?
Roughly 30 to 50 closed-won accounts in the trailing 6 to 12 months is a reasonable floor. Below that, the sample is too small to separate a real pattern from coincidence.
#Should I include churned customers in my seed list?
No. Split your closed-won list into healthy, expanding accounts and churned or fragile accounts, and build the lookalike model only from the healthy group.
#What data should a lookalike model use besides company size and industry?
Tech stack, funding stage, hiring velocity in relevant roles, geography, and where available, behavioral signal like website traffic pattern and review site activity.
#Are behavioral lookalikes better than firmographic lookalikes?
They answer different questions. Firmographic matching narrows the universe to plausible buyers. Behavioral matching adds timing on top of that universe. Most working programs use both together.
#How big should my lookalike list be?
Start with the top decile of scored accounts, roughly the top 10% by similarity, rather than working the entire ranked list at once. Expand into lower tiers only after the top tier has been worked.
#Why did my lookalike list convert worse than expected?
Check three things first: whether the seed list included fragile or churned accounts, whether the similarity threshold was set too loose, and whether the list was validated on a small batch before scaling.
#How often should I rebuild a lookalike model?
Whenever your win pattern shifts meaningfully, typically every quarter, or immediately after a pricing or product change that alters who your ideal buyer actually is.
#Can a lookalike model replace manual account research?
No. It replaces the sourcing step, deciding which accounts to look at. It does not replace the research needed to personalize outreach to any individual account on the resulting list.
#What is a false positive in lookalike sourcing?
An account that scores highly similar to your seed accounts on the attributes measured, but does not share the underlying reason those seed accounts actually bought.
#Should every account on a lookalike list get the same outreach cadence?
No. Fold the ranked list into your account tiering system so the highest-scoring, highest-signal accounts get deeper research and the lower-scoring tail runs on a lighter cadence.
#How do I validate a new lookalike batch before scaling it?
Run a small batch of 200 to 300 accounts through a real sequence and compare reply and meeting rate against your existing baseline before committing full campaign volume.
#What reply rate should a good lookalike batch produce?
A well-matched batch should land within range of a systematised campaign's typical 10 to 18% reply rate. A batch closer to 1 to 3% suggests the similarity score missed the real driver of your wins.
#Does lookalike sourcing work for a small total addressable market?
It works but the list will be small by definition, since there are fewer companies to compare against. Treat every match as high value rather than trying to force volume out of a small pool.
#What is the biggest mistake teams make with lookalike lists?
Skipping the negative signal filter and the validation batch, and sending the entire ranked list at full volume the moment it is generated.
#Can I combine lookalike sourcing with intent data?
Yes, and it is one of the stronger combinations available. Firmographic lookalike matching narrows who to look at, and live intent or buying signal tells you when to reach out to them.
#Does a lookalike model need a data science team to run?
No. Most B2B data providers and prospecting platforms run the similarity scoring for you. The judgment work, seed list quality and validation, is the part that still needs a human.
#How is a lookalike list different from a competitor customer list?
A competitor customer list tells you who bought something similar from someone else. A lookalike list tells you who resembles the accounts that bought specifically from you, which is a narrower and usually more predictive signal.
#What should I do if I do not have enough closed-won accounts to build a model?
Use a proxy seed list built from your best-fit active pipeline instead, and treat the resulting lookalike list as a lower-confidence test batch rather than a scaled campaign until real closed-won data accumulates.
#Conclusion
Lookalike account sourcing is a genuine improvement over sourcing from a static ICP document, because it is built from what actually happened rather than what someone once assumed would happen.
It is not a shortcut around judgment. A similarity score tells you two companies look alike on the attributes you measured, and nothing more.
The teams getting real pipeline out of lookalike sourcing are the ones auditing their seed list, filtering for negative signal, validating a small batch before scaling, and folding the ranked output into a tiering system instead of blasting the whole list at once.
Skip any of those steps and you get a list that looks scientific and performs like a cold, unqualified one. Do them, and closed-won data becomes the sourcing engine it was always capable of being.