
#Email metrics after open rates died: what to track in 2026
Copy page
TL;DR: Apple's Mail Privacy Protection and bot-driven security scanners made the open rate unreliable the moment they shipped, and most cold email teams still report it as their top KPI. Replace it with a four-metric stack: reply rate, positive reply rate, human click rate, and inbox placement rate, each pulled from a source open pixels cannot fake.
#The open rate stopped meaning anything in 2021
Apple shipped Mail Privacy Protection in iOS 15 in September 2021.
The feature pre-fetches every tracking pixel for every email, whether a human ever opens the message or not.
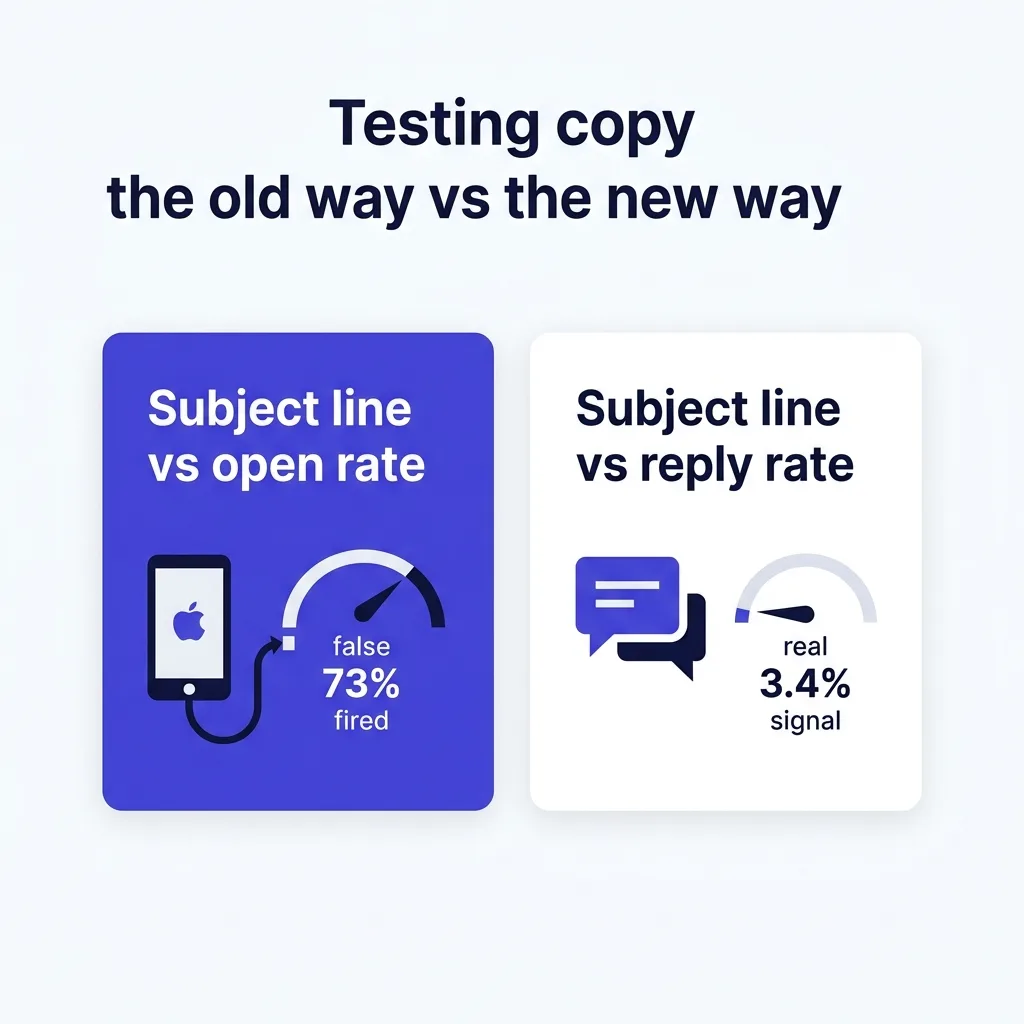
Paubox found that Apple's privacy proxy fires tracking pixels for roughly 73% of the mail it touches, regardless of real engagement (Paubox).
Validity and other deliverability vendors reported that pre-MPP open rates in the 20-30% range jumped to 40-60% or higher after the update, with zero change in actual reader behavior (Validity).
That gap is not noise. It is a structural distortion that never goes away.
Security scanners add a second layer of fake signal on top of Apple's proxy.
Corporate email gateways from Proofpoint, Mimecast, and Microsoft Defender open every inbound message automatically to scan for malware, firing the tracking pixel before a human ever sees the subject line.
A sales team reading "62% open rate" on a B2B campaign is often reading a mix of Apple's proxy, a security bot, and maybe a real person, with no way to separate the three from the pixel data alone.
FirstSales strips open rate from its default campaign dashboard for exactly this reason: it stopped correlating with pipeline the year Apple shipped MPP.
Yahoo and Microsoft never built an equivalent proxy at the scale of Apple's, but both platforms run their own inbound filtering and image-caching behavior that adds smaller, harder-to-quantify noise on top of the Apple distortion.
The combined effect is a metric that moves for reasons that have nothing to do with your subject line, your copy, or your targeting, which makes it close to useless for decision-making even when it still looks reassuring on a dashboard.
#Why teams still report a dead metric
Old habits are the main reason.
Open rate was the first metric email marketing tools ever shipped, back when tracking pixels worked cleanly and inboxes did not pre-fetch or scan.
Sales leaders learned to read a weekly open rate number the way they learned to read a thermometer, and swapping it out feels like losing a diagnostic tool even though the tool broke years ago.
The second reason is vanity.
A 55% open rate looks impressive in a board deck.
A 3.8% reply rate looks small next to it, even though the reply rate is the number that predicts revenue.
Teams that keep reporting open rate as a primary KPI are optimizing for a number that cannot go down for the wrong reasons and cannot go up for the right ones.
#The four metrics that replaced it
#Reply rate
Reply rate counts every response your inbox receives after a send, positive, negative, or an out-of-office.
It is the closest thing cold email has to a ground-truth engagement signal, because a bot cannot write a coherent reply to a specific sentence in your email.
Recent benchmark data puts average cold email reply rates around 3.4%, with top-performing segments in the 10-20% range when targeting and copy are tight (2026 context).
Track it per sequence step, not just per campaign, because step 1 and step 3 rarely convert at the same rate.
#Positive reply rate
Total reply rate mixes "interested" with "remove me" and "wrong person," which flattens the signal you actually care about.
Positive reply rate isolates responses that show real interest: a meeting request, a question about pricing, a forwarded introduction.
This is the number that maps most directly to pipeline, and it is the one FirstSales surfaces first on every campaign summary.
A campaign with a 6% total reply rate and a 1% positive rate is underperforming a campaign with a 4% total reply rate and a 2.5% positive rate, even though the first number looks bigger.
#Human click rate
Link clicks share the same pollution problem as opens: security scanners click links to check them for malware before a human ever sees the email.
The fix is not to abandon click tracking, it is to filter it.
Compare click timestamps against open timestamps and known bot user-agent patterns, and strip clicks that happen in the first 2-3 seconds after delivery, since no human reads and clicks that fast.
What remains is a much smaller number, but it is a real one, and it is useful for judging whether a case study link or calendar link actually gets used.
#Inbox placement rate
Placement measures whether your email lands in the primary inbox, the spam folder, or gets blocked outright, independent of whether the recipient interacts with it.
Google Postmaster Tools and similar tools from Microsoft give you domain-level and IP-level reputation data that predicts deliverability problems before your reply rate drops (Google Postmaster Tools guide).
Placement is a leading indicator. Reply rate is a lagging one.
Watching both together tells you whether a reply rate drop is a copy problem or a deliverability problem, which changes what you fix.
#Building the replacement dashboard
Start with reply rate and positive reply rate as your two headline numbers.
Report them per sequence step so you can see where prospects drop off.
Add inbox placement rate as a weekly health check, not a per-campaign metric, since placement moves at the domain level over days, not per send.
Add human click rate only if your sequence relies on links, such as a case study or booking page, since it is the noisiest of the four and needs the bot-filtering step to mean anything.
Drop open rate from the dashboard entirely, or keep it in a footnote labeled "unreliable, Apple MPP and bot traffic inflate this number."
#What this changes about how you test copy
 What this changes about how you test copy
A/B testing subject lines against open rate has been broken since 2021, because you are testing which subject line gets pre-fetched by more Apple devices, not which one a human finds compelling.
Test subject lines against reply rate instead, even though it takes a larger sample size to reach significance.
The same logic applies to send-time optimization: "best time to send" studies built on open-rate data are measuring when Apple's proxy fires, not when humans check their inbox (best time to send guide).
Rebuild your send-time tests around reply timestamps, and the "optimal" hour usually shifts.
#Comparing the old stack to the new one
| Metric | Reliable signal in 2026 | Why |
|---|---|---|
| Open rate | ✗ | Apple MPP and security bots pre-fetch pixels regardless of human action |
| Total reply rate | ✓ | Requires a human to read and compose a response |
| Positive reply rate | ✓ | Isolates genuine buying interest from noise replies |
| Raw click rate | ✗ | Security scanners click links automatically before delivery |
| Filtered human click rate | ✓ | Removes bot clicks by timestamp and user-agent pattern |
| Inbox placement rate | ✓ | Measured server-side via Postmaster tools, not a pixel |
| Bounce rate | ✓ | SMTP-level rejection, not client-side tracking |
| Spam complaint rate | ✓ | Reported directly by mailbox providers, not a pixel |
#What good looks like once you switch
A healthy cold email program in 2026 runs a bounce rate under 2%, a spam complaint rate under 0.3%, and an inbox placement rate above 90% (cold email benchmarks).
On top of that foundation, a 3-5% total reply rate with a 1-2% positive reply rate is solid for a cold, unsegmented B2B list.
Highly targeted, signal-based campaigns push positive reply rates into the 5-10% range because the targeting does half the persuasion work before the email ever gets written (signal-based cold email).
None of those numbers show up if your dashboard still leads with open rate.
#How open rate became the default metric in the first place
Email marketing platforms in the early 2000s needed a number that was cheap to compute and easy to explain to a client.
A 1x1 transparent tracking pixel, embedded in the HTML body, fires a server request the moment an email client renders images.
That request became "an open," and the metric spread across every ESP, CRM, and sales engagement tool built afterward, because it was simple to implement and simple to put in a slide.
For roughly fifteen years, the pixel worked reasonably well, since most email clients rendered images automatically and did not pre-fetch content for privacy reasons.
Gmail's own image proxy, introduced in 2013, already caused some inflation by caching images server-side, but the distortion was small compared to what came next.
Apple's Mail Privacy Protection changed the math completely, because it does not just cache an image, it fires the pixel for every message regardless of whether the recipient looks at it.
Sales engagement tools inherited the open-rate habit from email marketing and never fully corrected for it, which is why cold email dashboards in 2026 still default to a chart that has been broken for half a decade.
#How to walk stakeholders off the old metric
A sales leader who has reported open rate for years will not drop it because a blog post told them to.
Show the correlation break directly: pull six months of your own campaign data and plot open rate against closed-won pipeline.
In most B2B cold email programs, that correlation is flat or negative, since higher open rates often just mean more Apple Mail recipients in the list, not more interested prospects.
Pair that chart with a second one showing positive reply rate against the same pipeline data, where the line usually slopes up cleanly.
Frame the switch as an upgrade, not a downgrade: "We are moving from a number Apple broke in 2021 to the number that actually predicts revenue."
Keep one open-rate row in the report for a transition period, labeled clearly as unreliable, so nobody feels blindsided when it disappears the following month.
#A reporting checklist for evaluating your sending platform
 A reporting checklist for evaluating your sending platform
Not every cold email tool makes this transition easy, since some platforms still lead their dashboards with open rate by default.
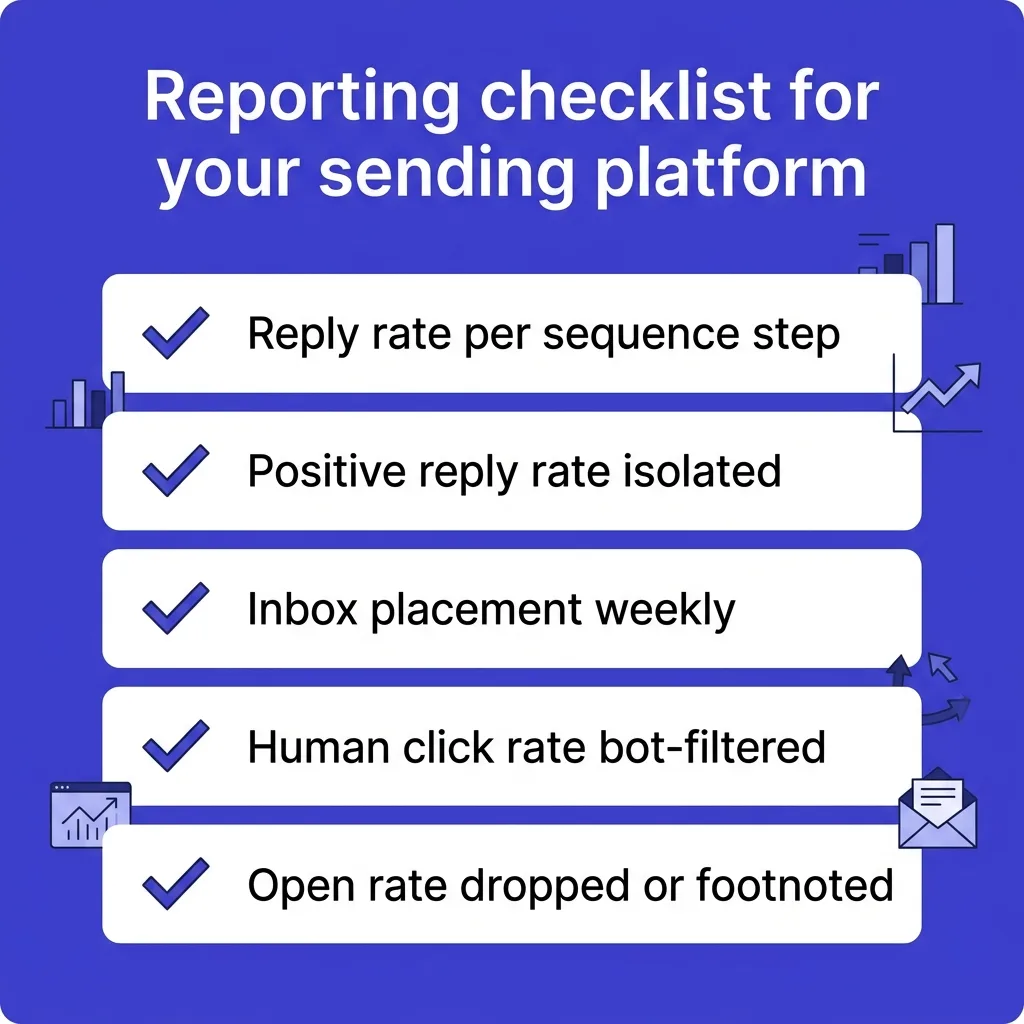
Before you commit to a sending platform, confirm it separates reply rate from positive reply rate rather than lumping every response into one bucket.
Confirm it exposes inbox placement data, either natively or through an integration with Google Postmaster Tools, instead of relying on open pixels for deliverability signal.
Confirm it timestamps replies against sequence steps, since knowing which email in a 5-step sequence drove the response tells you far more than a single blended number.
FirstSales builds its default reporting around these four checks specifically because open-rate-first dashboards keep sales teams optimizing for a broken signal months after everyone privately admits it does not work.
A platform that still makes open rate the hero metric on its home dashboard is a signal the product was not rebuilt for a post-MPP world.
#What other channels teach us about metric decay
Cold email is not the only channel where the headline metric quietly stopped meaning what it used to.
Display advertising went through the same shift when ad blockers and bot traffic made raw impression counts unreliable, pushing serious advertisers toward viewable impressions and, eventually, conversion-based attribution.
LinkedIn connection request acceptance rate followed a similar path once automation tools flooded inboxes with generic requests, forcing marketers to weight acceptance against actual profile engagement instead (LinkedIn connection request limits).
The pattern repeats: a platform change or a wave of automated traffic breaks a metric's assumptions, and teams keep reporting it anyway because switching costs are organizational, not technical.
Cold email's open-rate problem is unusually clean to diagnose, since a single, dated, well-documented change (Apple's MPP launch) explains almost the entire distortion.
That clarity is an advantage: you do not need a research team to prove the metric broke, you need one chart and a link to Apple's own developer documentation.
#Building reply-rate benchmarks specific to your list
Industry-wide reply rate benchmarks are a starting point, not a target, because list quality, industry, and seniority all shift the baseline meaningfully.
A campaign targeting VP-level buyers in a niche vertical with a highly relevant trigger event will often beat the 3.4% average by a wide margin, while a broad, cold, unsegmented list of generic job titles will often fall short of it.
Build your own baseline by running a control sequence for 4-6 weeks against a representative slice of your total addressable market, then treat that number, not the industry average, as your internal floor (TAM reality check).
Segment the baseline by list source too, since a list built from intent signals typically outperforms a list scraped from a generic firmographic filter by a wide margin (intent-based prospecting vs static lists).
Revisit the baseline quarterly, because deliverability conditions, competitor volume, and buyer attention all shift enough over three months to make a stale benchmark actively misleading.
Once you have an internal baseline built on reply rate, use it to judge new copy, new segments, and new sequences instead of comparing against a generic number that ignores your specific list and industry.
#Common mistakes teams make when they switch metrics
The first mistake is switching all at once, without a transition window, which leaves stakeholders confused when a familiar chart disappears overnight.
Roll the change out over 4-6 weeks, showing both metrics side by side before dropping open rate entirely.
The second mistake is treating total reply rate as the finish line, when positive reply rate is the number tied to revenue.
A team that optimizes purely for total replies can end up writing copy that generates more polite rejections, since "no thanks, remove me" counts the same as "yes, let's talk" in a raw reply count.
The third mistake is ignoring inbox placement once open rate is gone, since placement is the only leading indicator left in the new stack.
A reply rate drop with no placement change points to a copy or targeting problem, but a reply rate drop that follows a placement drop points to a deliverability problem, and conflating the two wastes weeks chasing the wrong fix.
The fourth mistake is under-sampling: reply rate needs more sends to reach statistical significance than open rate did, because it is a smaller, cleaner signal with less absolute volume.
A/B tests that ran on 200 sends per variant under the old open-rate framework often need 500-1,000 sends per variant to produce a reliable reply-rate verdict.
The fifth mistake is forgetting seasonality: reply rates move with the calendar, dropping around major holidays and picking back up during Q1 planning season and Q4 budget cycles (Q4 budget-flush outbound playbook).
A reply rate that looks flat in late December against a November baseline is not necessarily a broken campaign, it may just be the calendar.
#What this means for how you compensate SDR teams
Commission and quota structures built around open rate quietly rewarded list size over list quality, since a bigger, junkier list produces more fake opens without producing more revenue.
Rebuilding compensation around positive reply rate changes SDR incentives immediately: reps start caring more about targeting accuracy and personalization depth, because a generic blast to 10,000 contacts no longer looks good on a dashboard that only tracks real interest.
Some sales organizations pair positive reply rate with a downstream metric, like meetings booked or opportunities created, to make sure the incentive chain runs all the way to pipeline rather than stopping at "got a reply."
That downstream check matters, since a positive reply is still one step removed from a booked meeting, and a small share of positive replies never convert to a calendar event for reasons unrelated to the email itself.
Teams that make this switch usually see a short dip in total send volume as reps stop blasting broad lists, followed by a rise in meetings booked per rep within a quarter, because effort shifts from list size to list quality.
Most teams need 4-6 weeks and at least a few hundred sends per segment before a new reply-rate baseline stabilizes enough to trust for compensation decisions.
Shorter windows work for a directional read, but treat anything under two weeks of data as noisy, especially on a brand-new list or a freshly launched sequence.
#Frequently asked questions
#Why did open rates stop being reliable?
Apple's Mail Privacy Protection, shipped in iOS 15 in September 2021, pre-fetches every tracking pixel for Apple Mail users regardless of whether they open the email.
Corporate security scanners add a second layer of fake opens by scanning inbound mail automatically before delivery.
#Is open rate completely useless now?
It is not zero-signal, but it is unreliable enough that treating it as a KPI misleads more than it informs.
Use it only as a rough delivery confirmation, never as a measure of engagement or copy quality.
#What replaced open rate as the primary KPI?
Reply rate and positive reply rate are the closest things to ground truth, since both require a human to read the email and compose a response.
Inbox placement rate and filtered human click rate round out the replacement stack.
#How do I filter bot clicks from real ones?
Strip any click that happens within 2-3 seconds of delivery, since no human reads and clicks that fast.
Cross-reference click timestamps against known security scanner IP ranges and user-agent strings where your sending platform exposes that data.
#What is a good reply rate for cold email in 2026?
Average cold email reply rates sit around 3.4%, with top-performing segmented campaigns reaching 10-20% (cold email reply rate benchmarks).
Positive reply rate, which isolates real interest, typically runs at half to a third of total reply rate.
#Does Apple MPP affect Gmail and Outlook opens too?
No, Apple MPP only affects mail read through Apple Mail apps on iOS, iPadOS, and macOS.
Gmail's own image-caching proxy has caused similar but smaller distortions for over a decade, so Gmail opens were never fully clean either.
#Should I stop tracking opens entirely?
Stop reporting it as a headline KPI, but keep the raw data if your platform collects it for free.
A sudden total collapse in open pixel fires, even a fake number, can still signal a hard deliverability failure like landing in spam en masse.
#How does inbox placement rate get measured without pixels?
Placement is measured server-side through tools like Google Postmaster Tools, which reports reputation and spam-rate data directly from Google's infrastructure (Google Postmaster Tools for cold email).
Seed-list testing services also send to monitored inboxes across providers and report where the message actually landed.
#What's the difference between reply rate and positive reply rate?
Reply rate counts every response, including "unsubscribe me," out-of-office autoresponders, and outright rejections.
Positive reply rate counts only responses that signal genuine interest, such as a meeting request or a follow-up question.
#Why does positive reply rate matter more than total reply rate?
Positive reply rate maps directly to pipeline, while total reply rate can be inflated by rejections and automated bounces that look like engagement but generate zero revenue.
A campaign optimizing for total replies can accidentally optimize for more polite "no thanks" messages.
#How often should I check inbox placement rate?
Weekly is enough for most senders, since domain and IP reputation move over days, not hours.
Check it immediately after any change to sending volume, a new domain, or a new IP to catch problems before they compound.
#Can spam complaint rate replace open rate as an engagement signal?
No, spam complaint rate measures the opposite of engagement: how often recipients actively flag your email as unwanted.
Google and Yahoo require senders to keep this under 0.3% or face throttling and blocking (Google bulk sender rules).
#Does subject line testing still work without open rate?
Yes, but you have to test against reply rate instead, which needs a bigger sample size to reach statistical confidence.
Run subject line tests over a larger send volume or a longer window than you would with an open-rate test.
#What tools show reply rate cleanly without pixel pollution?
Most cold email sending platforms, including FirstSales, count replies by monitoring the connected inbox for new threads tied to a sent campaign, which does not rely on a tracking pixel at all.
This makes reply rate one of the few metrics in cold email that was never affected by MPP or bot scanning.
#How do I know if a reply rate drop is a copy problem or a deliverability problem?
Check inbox placement rate first.
If placement is stable and reply rate drops, the issue is likely copy, targeting, or list quality; if placement drops too, the issue is deliverability.
#Do B2C email marketers face the same open rate problem?
Yes, any sender relying on tracking pixels for open data faces the same Apple MPP distortion, whether the list is B2C or B2B.
The impact is often larger for B2C lists with a higher share of Apple Mail and Gmail users.
#What is bounce rate and why does it still matter?
Bounce rate measures the share of sends that get rejected at the SMTP level, either because the address does not exist (hard bounce) or a temporary server issue blocked delivery (soft bounce).
It is measured server-side, not through a pixel, so it remains one of the most reliable metrics available (cold email bounce rate).
#How do security scanners inflate click rates specifically?
Corporate gateways like Proofpoint and Mimecast follow every link in an inbound email to scan the destination for malware, which registers as a click before the human recipient ever opens the message.
This can add a flat percentage of fake clicks to every campaign regardless of content quality.
#Will Apple ever fix Mail Privacy Protection to allow accurate tracking?
Unlikely, since MPP was built specifically to prevent senders from tracking individual user behavior as a privacy feature, not a bug.
Apple has made small adjustments to when pixels pre-fetch since 2021, but the core privacy behavior has not changed and is not expected to.
#What should a weekly cold email report include instead of open rate?
Report reply rate and positive reply rate by sequence step, inbox placement rate, bounce rate, and spam complaint rate.
That combination gives a full picture of both deliverability health and actual human engagement, without a single number that Apple or a bot can silently distort.
Stop reporting a number Apple broke five years ago.
Build your dashboard around reply rate, positive reply rate, and inbox placement, and you will catch real problems weeks before a fake open-rate number would ever show one.
Make the switch gradually, show the old and new numbers side by side for a month, and let the reply-rate to pipeline correlation do the convincing your slide deck cannot.