Numbers live in five places
Sends in one tool, replies in your inbox, bounces in a report, meetings in your calendar. Putting them together is a job nobody has time for, so nobody does it.
Email analytics
Open a campaign and see where every contact is, what sends next, who opened, who replied, what bounced and which mailbox needs help. No exports, no spreadsheets, no waiting for a weekly report.
$1 for 3 days · Cancel anytime · No contract
Six engagement numbers per campaign
Journey status for every contact
The next 7 days of sends, at a glance
A health score for every mailbox
Most cold email goes quiet after you press send. You do not know what worked, what broke, or what to change next.
Sends in one tool, replies in your inbox, bounces in a report, meetings in your calendar. Putting them together is a job nobody has time for, so nobody does it.
One mailbox with rising bounces can drag a whole campaign down. If you only see one number for everything, you cannot tell which inbox is the problem.
Without clear numbers, you rewrite the email, swap the list and change the subject line all at once. When results move, you have no idea why.
There is no tracking to set up. Send your campaign and the numbers fill in on their own.
Connect your mailboxes, add your contacts and launch. Every campaign gets its own Analytics tab from the first send.
Sends, deliveries, opens, clicks, replies, bounces and goals are counted for you, and every contact's journey is tracked from start to finish.
Pick a date range, click any number to see the people behind it, and check which mailbox needs help. Then change one thing and watch what happens.
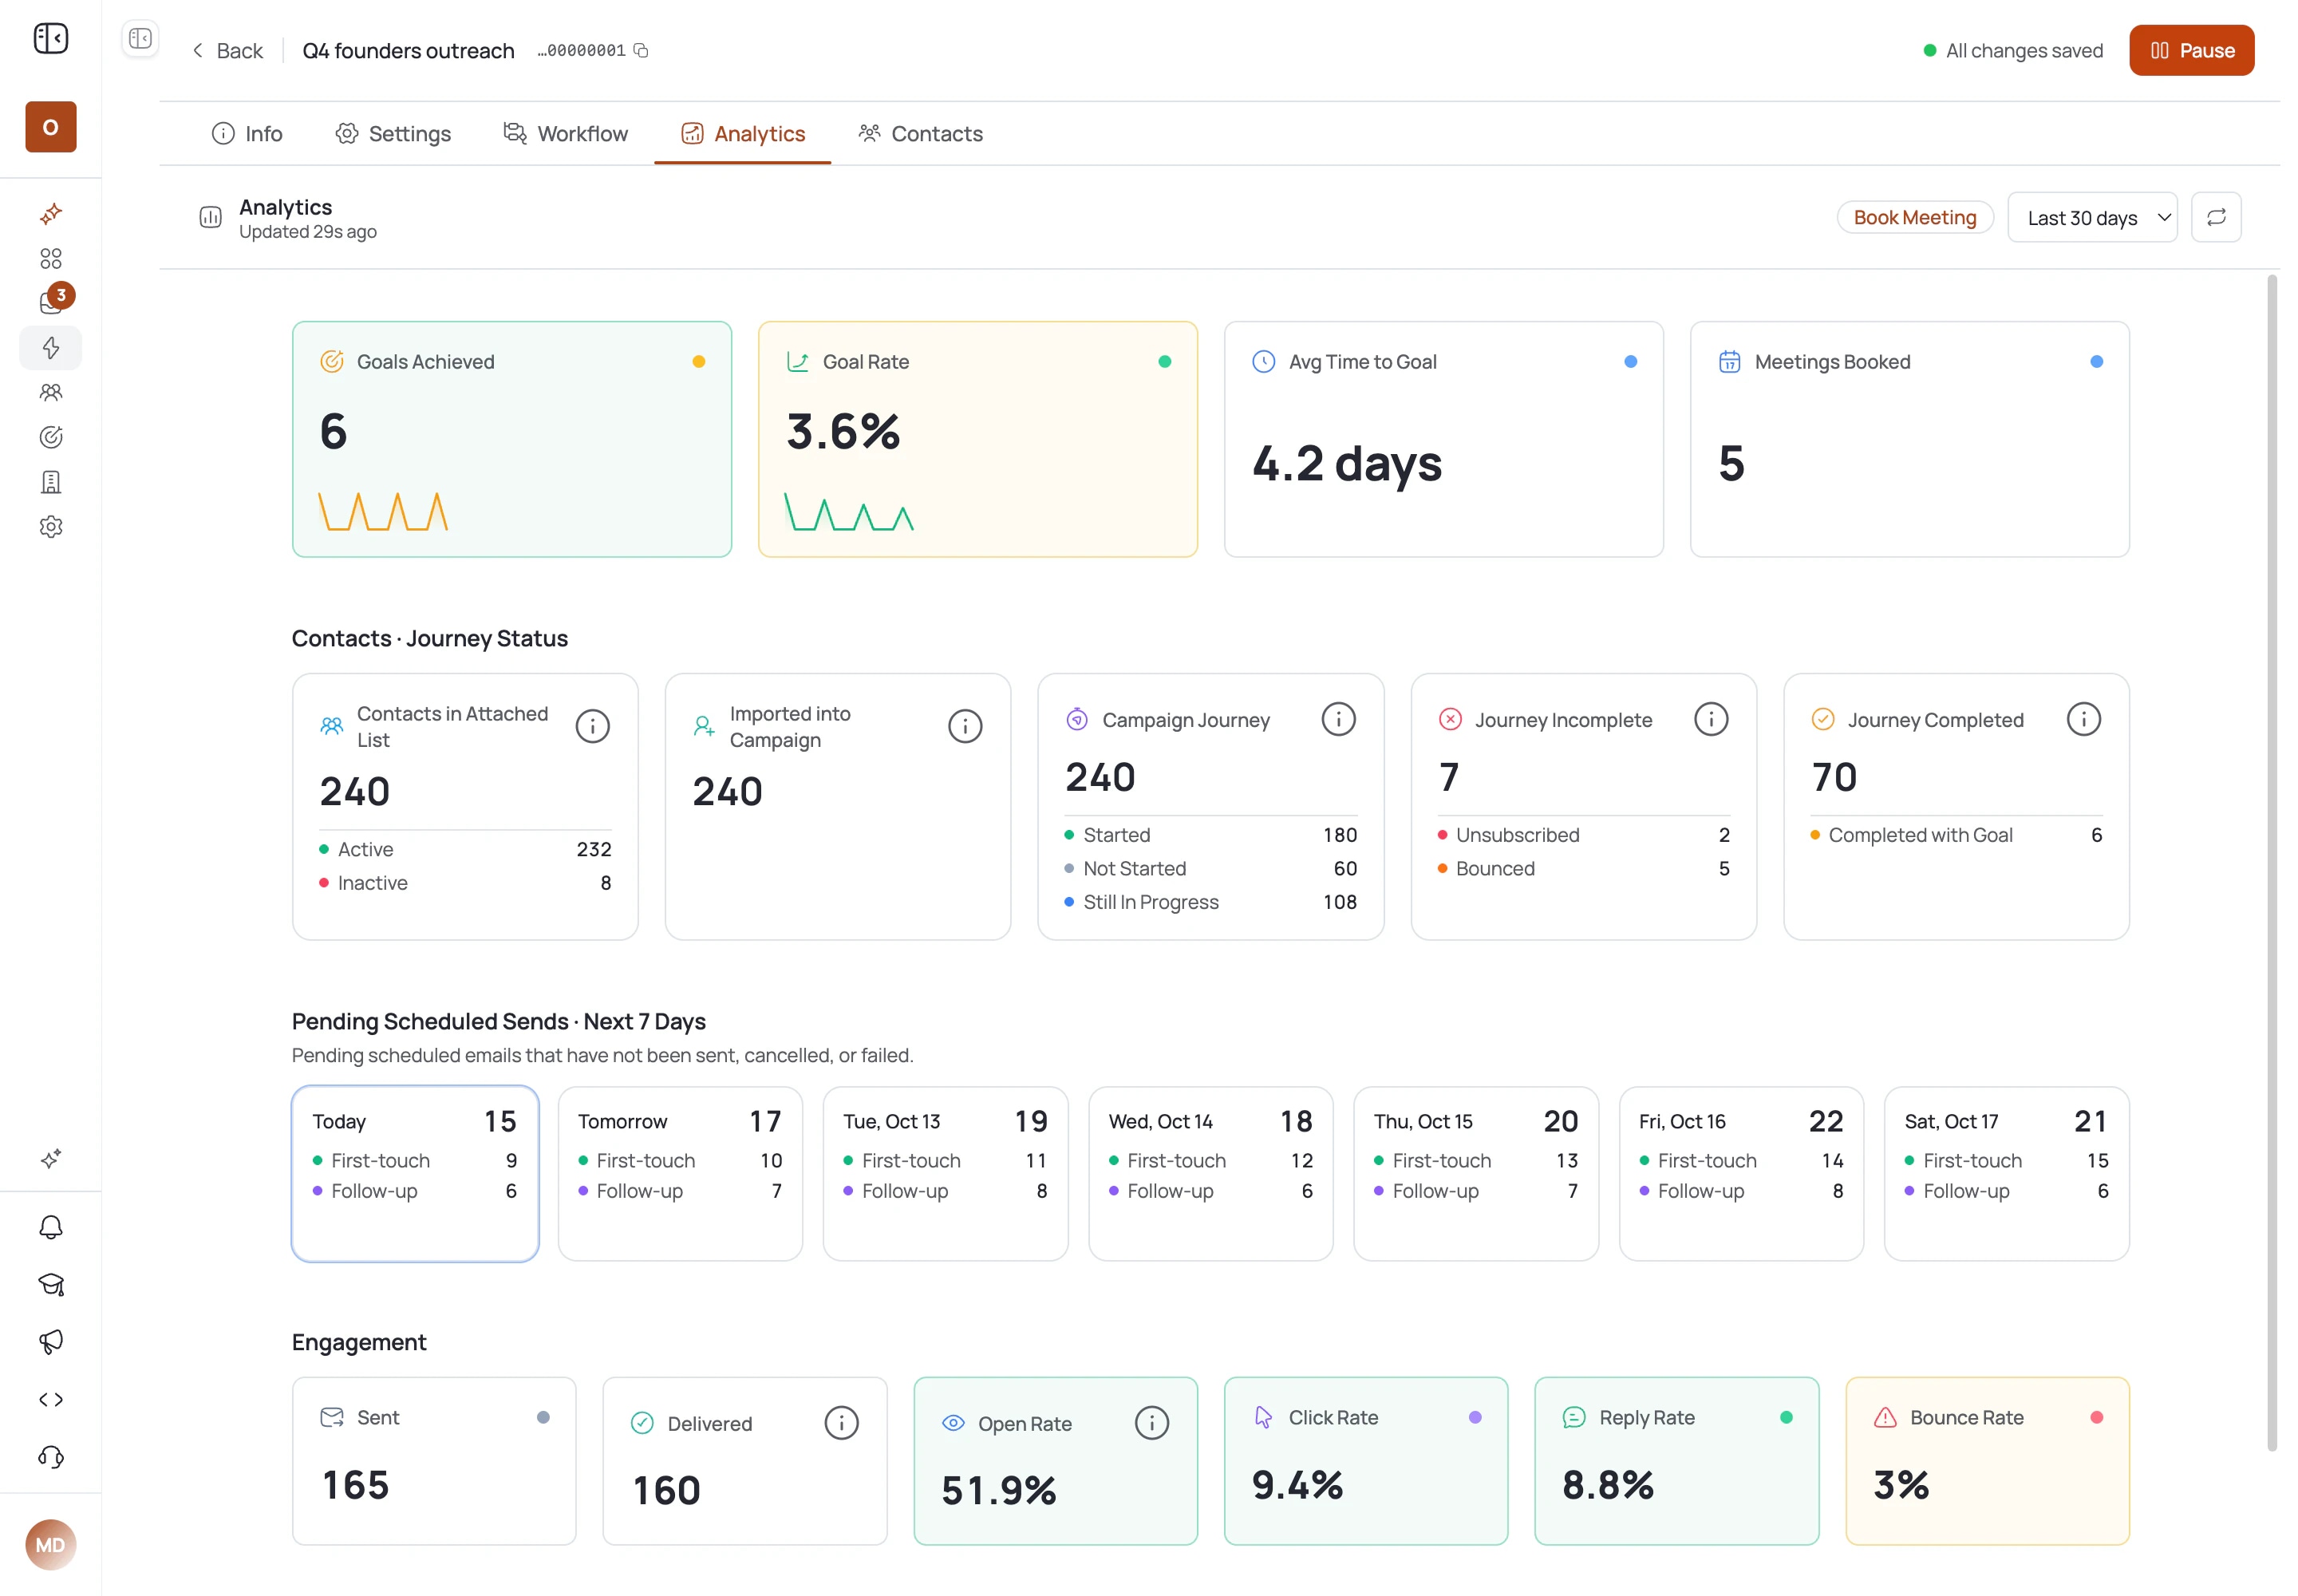
Every campaign has its own Analytics tab. Here is what each part of it shows, using the same labels you see in the app.
Journey status follows each contact from your list into the campaign and out the other side. You see how many started, how many have not started yet, how many are still in progress, and how many finished. Contacts who unsubscribed or bounced are counted apart, so they never hide inside a total.
Pending scheduled sends lists the next seven days, one card per day, split into first-touch emails and follow-ups. You know what goes out tomorrow before it goes.
Sent, delivered, open rate, click rate, reply rate and bounce rate sit side by side, each with a small trend line, for the date range you pick.
Sent performance over time draws sent, delivered, opened, replied and goals achieved by send date. Hover a day to see its numbers and goal rate.
Click a number to open the contacts behind it, such as everyone who opened or everyone who replied. Search by name, then open any contact.
Sender health gives every connected mailbox a score out of 100, next to its bounce rate and how much it has sent. Monitoring runs every hour, so a weak mailbox shows up early and the others keep sending.
Clear numbers for every campaign and every mailbox, included on every plan.
Sent, delivered, open rate, click rate, reply rate and bounce rate, side by side, with a trend line for each. You know in seconds whether a campaign is healthy.
Click a number to see who is behind it. Everyone who opened, everyone who replied, searchable and one click from their contact record.
The next seven days of scheduled sends, split into first-touch and follow-up, so you are never surprised by what leaves your mailboxes.
Every mailbox gets a health score with its bounce rate and send count. Monitoring runs every hour, so you see trouble in hours, not weeks.
Run A/B tests on subject lines and compare them on real replies. Change one thing at a time and the numbers tell you if it worked.
Set a goal for the campaign, such as a booked meeting, and see goals achieved next to sends and replies. Opens are a signal. Goals are the point.
Each one is a click away from the campaign you are working on.
The Analytics tab puts the whole campaign on one screen: where every contact is in the journey, what sends in the next seven days, and the six engagement numbers.
A percentage tells you how much. A list tells you who. Click the open count and the people behind it appear, ready to search.
Replies are the number closest to a conversation. Open the reply count to see every contact who answered, then reply to them from the inbox.
Each connected mailbox gets a health score out of 100, built from its bounce rate and warm-up, shown next to how much it has sent. Checked every hour.
A number is only useful if you know what to change. Here is each one on the Analytics tab in plain words, with the first thing to check.
Numbers are easy to collect and easy to misread. Here is how to use them to make your next campaign better, in plain words.
Most people look at opens first because it is the biggest number. Start with goals and replies instead. They tell you whether the campaign is doing its job. Then work upward: if replies are low, look at opens and clicks; if opens are low, look at delivery and bounces. Each step explains the one below it.
An open is counted when an email loads a tiny image. Some email apps load images on their own, and some people read with images off. So open rates can be too high or too low. They are still useful for comparing two subject lines inside the same campaign, but never as proof that a campaign works.
Delivered should be close to sent. When the gap grows, emails are bouncing, and bounces hurt your sender reputation. Look at where the list came from, keep contact checks on, and look at sender health for the mailbox that sent them. Fix this first: nothing else matters if emails do not arrive.
A campaign total can look fine while one mailbox is in trouble. That is why FirstSales scores every mailbox on its own and checks it every hour. If one score drops, you can slow it down or fix it while the others keep sending.
If you rewrite the email, change the list and swap the subject line on the same day, you will never know which change mattered. Pick one. Run an A/B test on the subject line, or try a new first line, and let enough emails go out before you decide.
Many replies come after the first email, not to it. Look at pending sends to see how many follow-ups are still to come before you judge a campaign. A campaign with most contacts still in progress has not finished talking yet.
Reply rate tells you how many people answered. The replies tell you why. A wave of “not the right person” means your list is off. Questions about price mean your offer is landing. Read a handful every week. It is the fastest research you will ever do.
Run through this once a week. It takes a few minutes in the Analytics tab and the inbox.
“If you are looking to fix your sales pipeline, you should definitely try [it]. My open rate has increased drastically. The UI and UX are easy to understand, even for a beginner like me.”
 Pooja Dhole@ThisIsPoojaD · X
Real words from real users. No paid reviews.
“User Interface, Ease of Use, Able to hit the inbox in the first attempt.”

Sadashiv B.
Founder, small business
“One of the best email outreach tools I have ever seen in my 9 years of business experience. It has solved the problem of email outreach for my cold emails.”

Santhosh K.
Founder and CEO, small business
“I have always struggled in cold outreach. However, Firstsales has provided an excellent tool for cold outreach.”

Kaushal S.
Founder, small business
What changes when every number lives next to the campaign that made it.
Exports, inbox searches and a spreadsheet.
One Analytics tab per campaign.
Many tools count sends and opens. FirstSales shows the whole journey and the health of every mailbox.
| What you get | Typical tool | FirstSales |
|---|---|---|
| Sent, delivered, opens, clicks, replies, bounces | Varies | Per campaign, with trend lines |
| Journey status per contact | Varies | Started to completed with goal |
| Pending sends | Varies | Next 7 days, first-touch and follow-up |
| People behind each number | Varies | Click to see who opened or replied |
| Goals | Varies | Goals achieved over time |
| Sender health | Varies | Score per mailbox, checked hourly |
| A/B tests | Varies | Subject lines, compared on replies |
| Mailboxes | Varies | Unlimited on every plan |
| Price | Varies | $29/mo, analytics included |
| Start your $1 trial | ||
Can’t find yours? Write to us.
For every campaign: sent, delivered, open rate, click rate, reply rate and bounce rate, sent performance over time with goals achieved, the journey status of every contact, and the sends scheduled for the next seven days. For every mailbox: a health score with its bounce rate and send count.
No. Every campaign gets its own Analytics tab from the first send. There is no tag, script or spreadsheet to set up.
Yes. Click the number and a list of the contacts behind it opens. You can search it and open any contact from there.
Treat them as a rough signal. Some email apps load images on their own and some people read with images off, so opens can be over or under counted. Use opens to compare subject lines, and judge campaigns on replies and goals.
Sender health gives each mailbox a score out of 100, next to its bounce rate and send count. Monitoring runs every hour, so a weak mailbox shows up early. Sending rotates to your healthy mailboxes while you fix it.
Yes. Run A/B tests on subject lines and compare them on the numbers in the Analytics tab, including replies.
No. Analytics is included on every plan, from $29/mo, with unlimited mailboxes. Try it for $1 for 3 days. No contract: cancel any time from your dashboard.
If you want a dashboard full of big open rates to show your boss, we are not your fit. FirstSales is for founders, sales teams and agencies who want to know which campaigns get replies and which mailboxes need help.
Connect unlimited mailboxes and let AI agents find leads, write each email and follow up. Or send your own templates in manual mode. From $29/mo.
$1 for 3 days · Cancel anytime · No contract