Where the numbers live
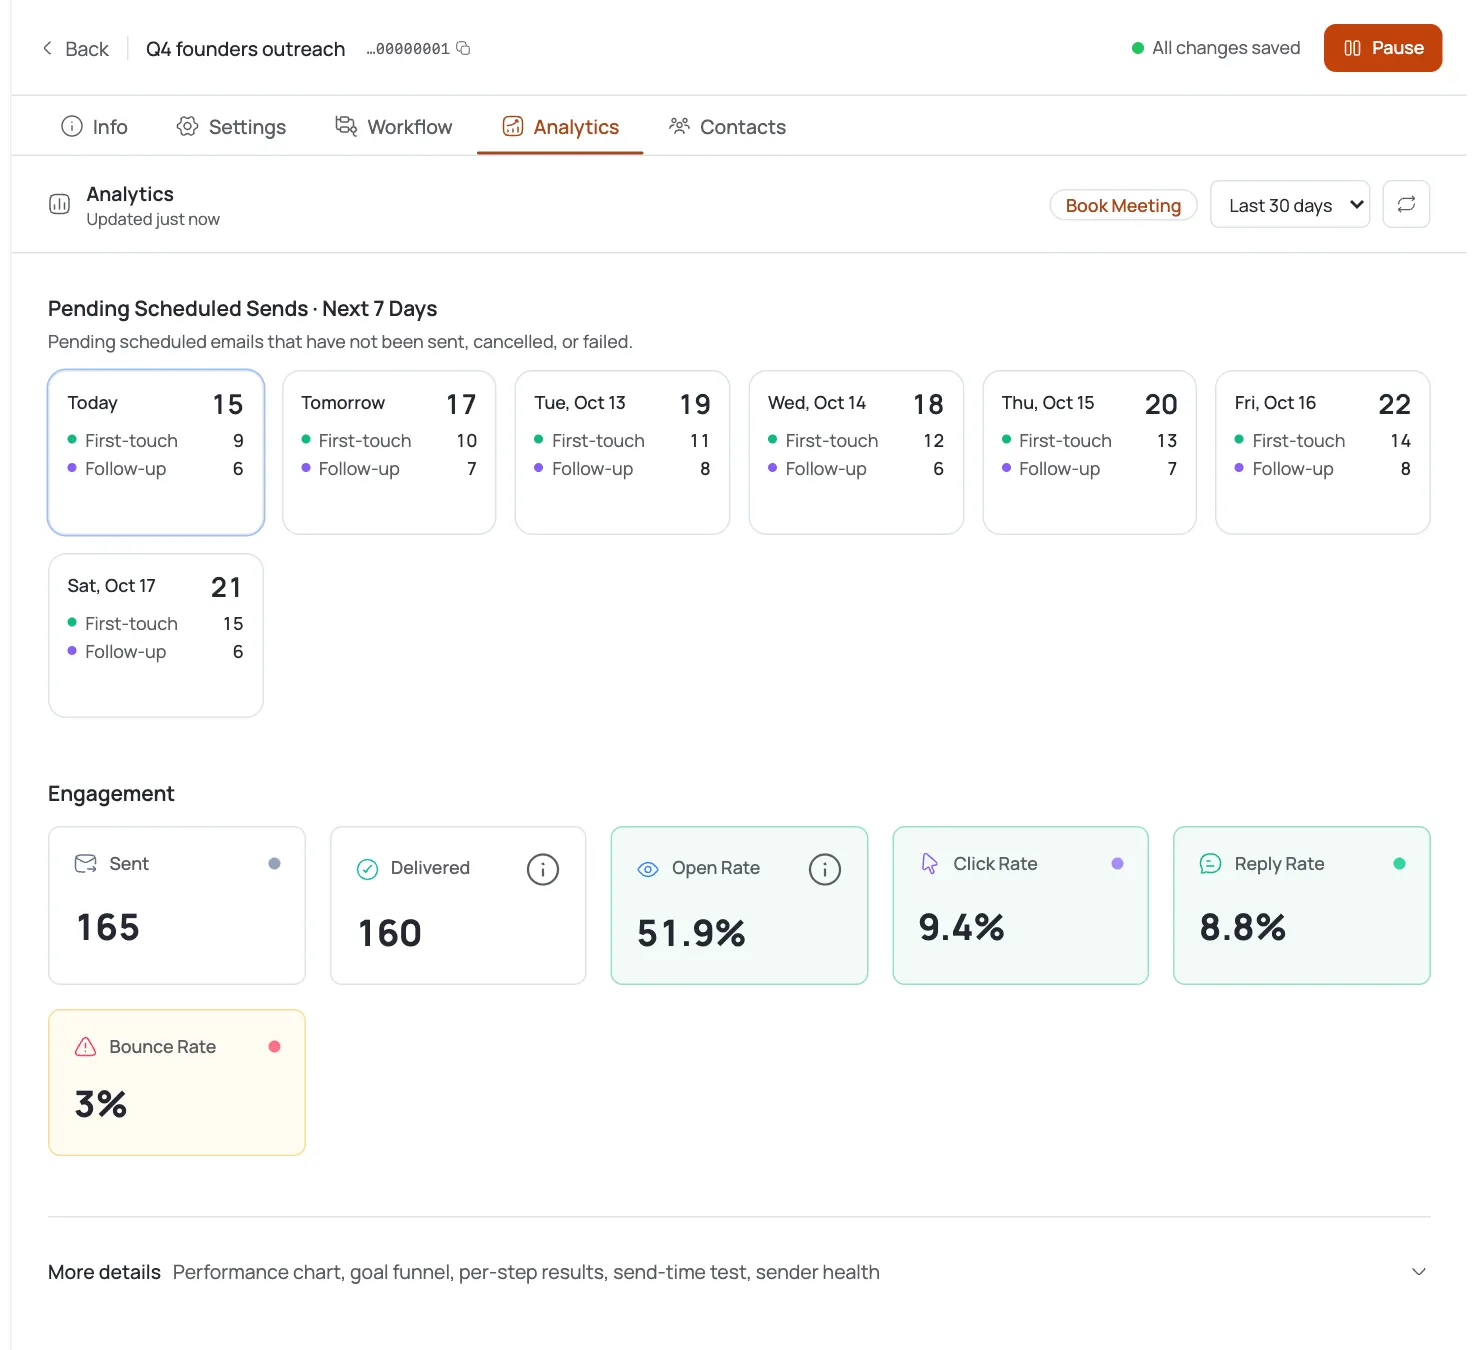
Open a campaign and go to its Analytics tab. The Engagement strip is the at-a-glance scoreboard: Sent and Delivered as counts, plus Open Rate, Click Rate, Reply Rate, and Bounce Rate as percentages. Everything below drills into those numbers.
Reply rate is the metric that matters
For cold outreach, reply rate (especially positive replies) is the real signal. Opens tell you the subject line worked; replies tell you the offer worked. Judge a campaign on replies and meetings booked, not opens.
A healthy cold campaign lands roughly in the low single digits on positive reply rate; if you're at zero after a few hundred sends, the problem is targeting or offer, not volume.
Treat open rate with suspicion
Open rate is a soft metric. Apple Mail Privacy Protection and other prefetchers auto-open emails, inflating the number: an open may not be a human. Use open rate as a rough directional read on subject lines and warm-up, never as your success metric.
If opens look great but replies are flat, that's the tell: people see it, the message isn't landing.
Watch Bounce Rate and Sender Health
Two numbers protect your sending reputation:
- Bounce Rate (keep it under 5% (ideally under 2%). Past 5% the app flags "High bounce rate."
- Sender Health) each mailbox is graded; a red flag appears at bounce over 5% or warm-up score under 50.
A red here is a stop-and-fix signal: pause, clean the list or warm the mailbox, then resume. Sending through it drags every future email toward spam.
Follow the funnel and per-contact journey
Below the strip, the funnel shows drop-off stage by stage (delivered, opened, replied), so you can see where people fall off. Click into a contact to see its journey: every step sent, opens, replies, and bounce/skip reasons on a timeline.
The journey view is where you diagnose a single stuck or bounced contact; the funnel is where you spot a systemic drop-off across the whole list.
Compare A/B variants
If the campaign runs A/B step variants, analytics breaks results out per variant so you can see which subject or body wins on reply rate. Let a variant accumulate enough sends before calling it: a handful of replies isn't a verdict. Winner selection is manual: review the metrics yourself, then edit or delete the underperforming variant.
Pro tips
Optimize for replies, not opens
Opens are inflated by privacy prefetch. Positive reply rate and meetings booked are the only numbers worth steering a campaign by.
A red Sender Health dot beats any vanity metric
Bounce over 5% or warm-up under 50 will sink deliverability regardless of how good opens look. Fix the red before you scale volume.
Use the funnel to find the leak
Great delivery, poor replies = message problem. Poor delivery = list/deliverability problem. The funnel tells you which one before you start guessing.
Give A/B variants time
A variant needs enough sends for its reply rate to mean anything. Declaring a winner on a dozen sends is noise, not a result.
Frequently asked questions
Where do I see campaign analytics?
On the campaign's Analytics tab. The Engagement strip shows Sent and Delivered as counts, plus Open Rate, Click Rate, Reply Rate, and Bounce Rate as percentages; below it are the funnel, Sender Health, and per-contact journeys.
Which metric should I judge a cold campaign on?
Positive reply rate and meetings booked. Opens are inflated by privacy prefetch and don't confirm a human read the email: replies do.
Why is my open rate so high but replies low?
Open rate is soft: Apple Mail Privacy Protection and other prefetchers auto-open emails, inflating it. High opens with flat replies usually means the message or offer isn't landing, not that opens are 'working'.
What bounce rate is acceptable?
Under 5%, ideally under 2%. Past 5% the app flags 'High bounce rate' and Sender Health turns red, which hurts deliverability for every future send.
What does Sender Health show?
A per-mailbox grade combining bounce rate and warm-up score. A red 'Health issues' flag appears when bounce exceeds 5% or the warm-up score drops below 50: treat it as a stop-and-fix signal.
How do I diagnose a single stuck contact?
Click into the contact to open its journey: a timeline of every step sent, opens, replies, and any bounce or skip reason. That's where you see exactly what happened to one person.
Can I compare A/B variants here?
Yes. When a step has A/B variants, analytics breaks results out per variant so you can compare reply rates. Give each enough sends before judging: winner selection is manual, so review the metrics yourself and edit or delete the underperformer.